
Markets are closed today.
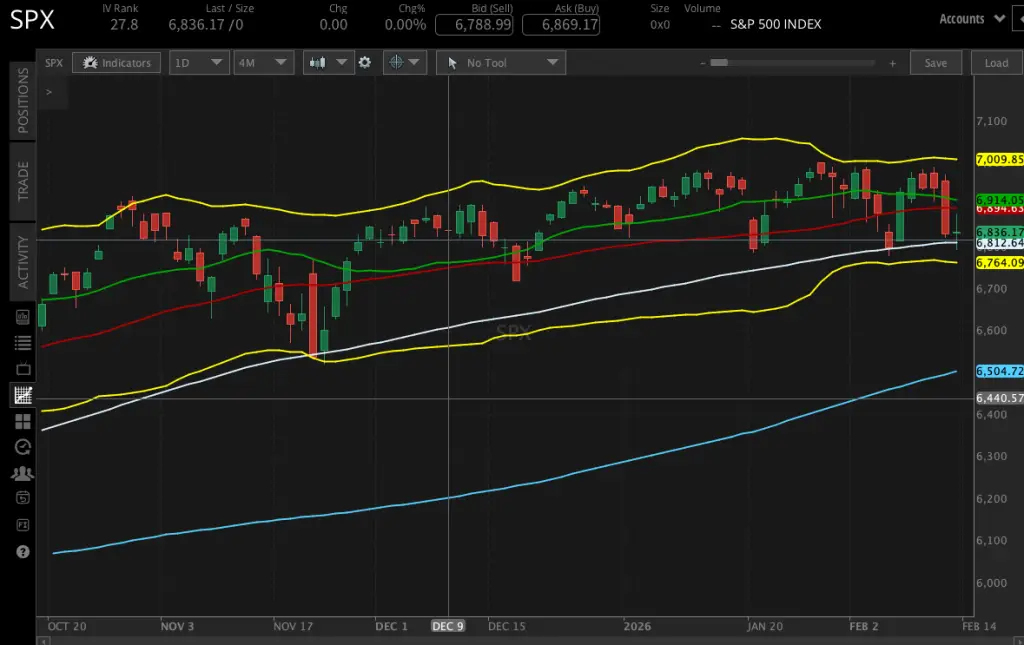
While the S&P 500 has stayed essentially unchanged for the year at 6,836.17, the Dow Jones has outperformed with a YTD return of approximately 2.31%, recently hitting 49,500.93. Conversely, the Nasdaq-100 has faced pressure, down roughly 1.87% YTD as investors grapple with AI trade continuity and sector rotations.
Top 10 Performers vs. Underperformers (2026 YTD)
The following lists identify the leading large-cap performers and those facing the steepest declines in the US market so far this year.
Top 10 Positive Performers
- Adlai Nortye Ltd (ANL): +589.13%
- Brand Engagement Network (BNAI): +454.91%
- Graftech International (EAF): +306.21%
- Algorhythm Holdings (RIME): +234.62%
- Erasca Inc (ERAS): +234.26%
- Alumis Inc (ALMS): +196.37%
- ImmunityBio Inc (IBRX): +194.31%
- 111 Inc (YI): +193.48%
- BioMx Inc (PHGE): +186.45%
- Lulu’s Fashion Lounge (LVLU): +171.96%
Top 10 Negative Performers
- Elme Communities (ELME): -87.56%
- Dogness International (DOGZ): -86.30%
- Metavia Inc: -82.85%
- La Rosa Holdings (LRHC): -81.15%
- Healthcare Triangle (HCTI): -76.69%
- Atara Biotherapeutics (ATRA): -74.96%
- Bit Origin Ltd (BTOG): -74.37%
- Gri Bio Inc (GRI): -70.54%
- BGM Group Ltd: -69.27%
- Digital Brands Group (DBGI): -68.55%
Key Market Drivers for February 2026
A “mini-crash” earlier in February was triggered by the release of advanced agentic AI models, causing a temporary sell-off in traditional software giants like Salesforce and Intuit due to fears of job displacement. However, commodity-oriented tech firms like SanDisk and Corning have seen massive valuation increases (up to 396% fair value increases) due to severe shortages in AI data center components.